See where your state fits into this ranking of states that depend on the gun industry for jobs, political contributions and gun ownership.
It's no secret that the gun industry is big business in America. The manufacture, sale, distribution and ownership of firearms generates a lot of money - a WHOLE LOT of money. And a whole lot of jobs, too.
WalletHub recently took a close look at the economic impact the gun industry has in the U.S., by comparing and ranking the states in accordance to their favorability or "friendliness" to the firearms, in both the manufacture and sale of guns as well as civilian ownership.
WalletHub "compared the economic impact of guns on each of the 50 states and the District of Columbia to determine which among them leans most heavily on the gun business both directly for jobs and political contributions and indirectly through ownership."
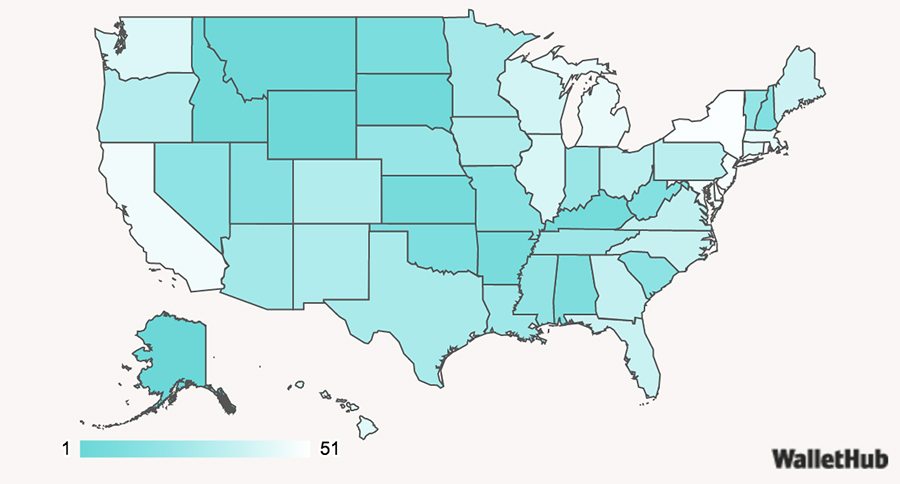
Click on any state on this map to see its rank and check out the infographic below for a presentation of their key findings.
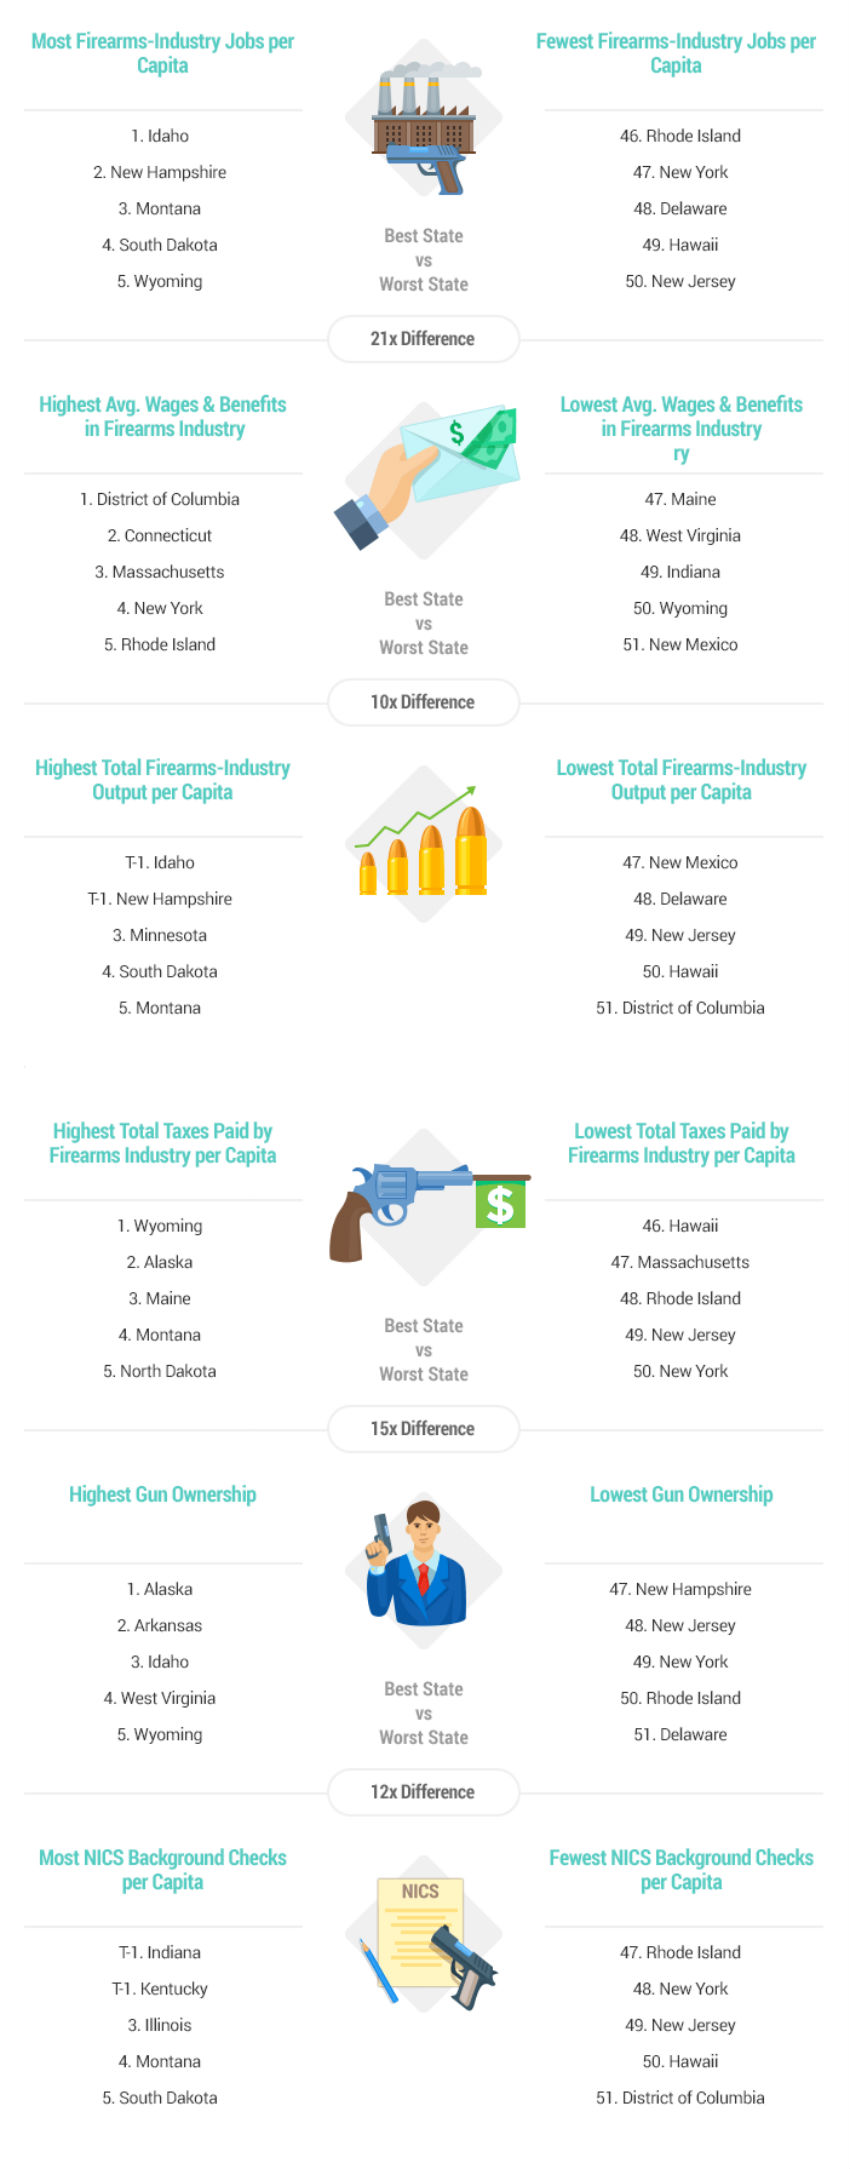
These 10 states were found to be most dependent on the firearms industry:
- Alaska
- Wyoming
- Montana
- South Dakota
- Idaho
- Kentucky
- Kansas
- Arkansas
- North Dakota
- Alabama
And these 10 were found to be the least dependent:
- Rhode Island
- Delaware
- New York
- New Jersey
- California
- Maryland
- Michigan
- Massachusetts
- Connecticut
- Hawaii
Here's how they did it:
WalletHub's Methodology
"In order to identify the states that most and least depend on the gun industry for economic stability, WalletHub's analysts compared the 50 states and the District of Columbia across three key dimensions: 1) Firearms Industry, 2) Gun Prevalence and 3) Gun Politics.
We evaluated those dimensions using 13 relevant metrics, which are listed below with their corresponding weights. Each metric was graded on a 100-point scale, with a score of 100 representing the "most gun-industry-dependent" state.
We then calculated the overall score for each state and the District based on its weighted average across all metrics and used the resulting scores to construct our final ranking."
Firearms Industry - Total Points: 35
- Firearms-Industry Jobs per Capita: Double Weight (~7.78 Points)
- Firearms Dealers & Importers per Capita: Full Weight (~3.89 Points)
- Firearms Manufacturers per Capita: Full Weight (~3.89 Points)
- Average Wages & Benefits in Firearms Industry: Full Weight (~3.89 Points)
- Total Firearms-Industry Output per Capita: Full Weight (~3.89 Points)
- Total Taxes Paid by Firearms Industry per Capita: Full Weight (~3.89 Points)
- Presence of State Law Granting Immunity to Gun Industry: Full Weight (~3.89 Points)
Note: This binary metric considers the presence or absence of a state statute that protects gun manufacturers and dealers from liability lawsuits. It is similar to the Protection of Lawful Commerce in Arms Act, or PLCAA. - Strictness of State Gun Laws: Full Weight (~3.89 Points)
Note: "State Gun Laws" include mental-health records reporting, private-sale background checks, open-carry regulations, concealed carry regulations, prohibition of access to domestic abusers, disarming dangerous people laws, child access prevention, and waiting periods before gun transfers.
Gun Prevalence - Total Points: 35
- Gun Ownership Rate: Full Weight (~11.67 Points)
- Gun Sales per Capita: Full Weight (~11.67 Points)
Note: Approximated using National Instant Criminal Background Check System (NICS) data. - Gun Ads for Private Buying & Selling: Full Weight (~11.66 Points)
Note: This composite metric uses data from Third Way to measure private-seller for-sale ads for firearms per capita and want ads seeking to purchase from private sellers per capita.
Gun Politics - Total Points: 30
- Gun-Control Contributions to Congressional Members per Capita: Full Weight (~15 Points)
- Gun-Rights Contributions to Congressional Members per Capita: Full Weight (~15 Points)
This is interesting and, of course, a rather subjective set of measurements by which to make a final judgment on how states rank.
WalletHub also assembled a panel of so-called "experts" and asked them a number of questions related to gun control and legislation. That portion of their article is, I think, irrelevant to the more objective analysis of the economic impact of the firearms industry.
More to the point, The National Shooting Sports Foundation (NSSF) released a report that outlines the economic impact of the firearms industry on the federal and each state's economy. They found that the industry generates over 300,000 jobs, over $15 billion in wages and more than $51 billion in economic impact.
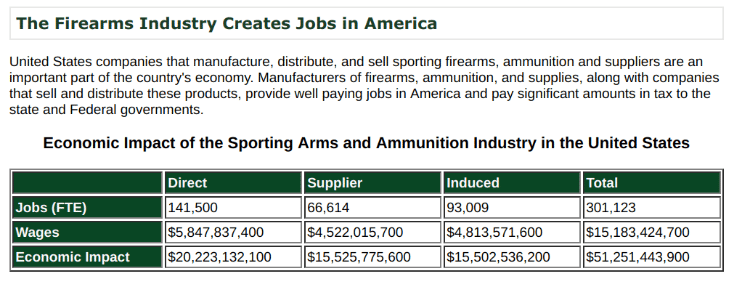
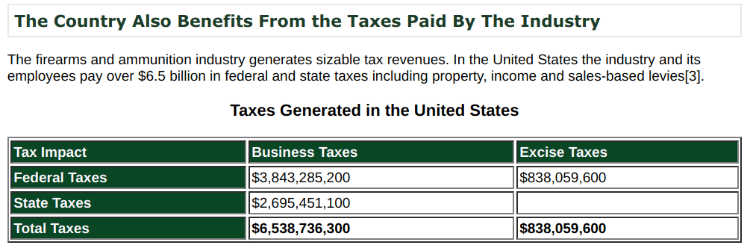
The gun industry also produces billions of dollars in tax revenue for the country and states where it is a significant force. Almost $7.5-billion in taxes on both the state and federal levels were generated by the firearms industry last year.
This analysis only confirms what seems obvious: that is, that those states with healthy and vibrant firearms manufacturing operations, sale and distribution outlets, and higher citizen gun ownership rates, generally receive much more in the way of positive economic impact. And of course more people are employed by the gun industry and receive financial benefits in gun friendly states.
At a time when state budgets are hotly contested issues, it seems foolish that some states - California and New York immediately come to mind - want to push away this significant source of tax revenue and job creation, particularly for an industry that supports a guaranteed right for its citizens.
Like what you see here? You can read more great articles by David Smith at his facebook page, Stumpjack Outdoors.
NEXT: Fabio Warns Americans "Don't You Ever Give Up Your Guns!"